Building a dashboard with Google BigQuery and DataStudio (1/2)
Dashboards and information screens are becoming increasingly common for monitoring and displaying important, relevant information at a glance. Over the following two blog posts, we will look at how I, without much programming skills, was able to build such a dashboard in the cloud using Google’s BigQuery and DataStudio tools.
3 min read
·
By Morten Winther Wold
·
December 13, 2019
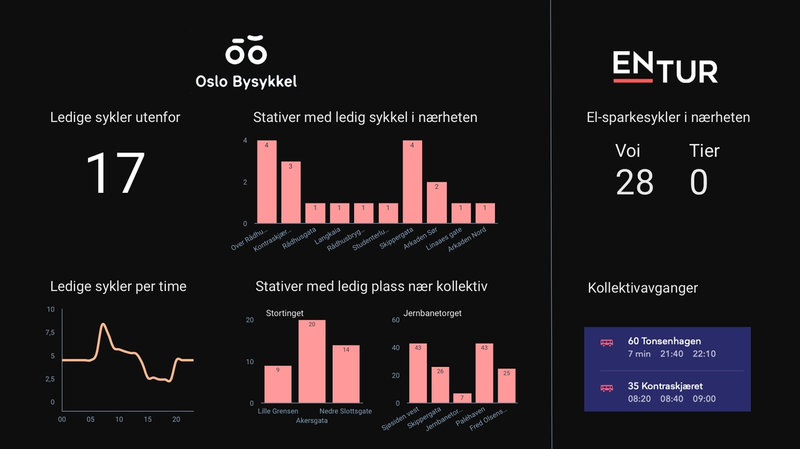
Bekk’s Oslo office is located at the tip of Vippetangen. Thus our employees are mostly dependent on public transportation to get to clients, social events or back home from work. We wanted to build a simple dashboard in our reception hall that would provide employees and visitors with realtime information about nearby buses, city bikes and electric scooters on their way out of the office.
The Google Cloud Platform (GCP) combines powerful cloud tools with the simplicity and ease of use from Google services. To build the dashboard data, we made use of BigQuery. BigQuery is part of GCP and is a serverless tool ideal for performing analysis on large datasets using the SQL language, without the need for administering a local database.
1. Obtain and store your data
BigQuery has plenty of huge, open datasets you can play around with, or you can connect directly to common services such as Google Analytics.
As the dashboard had to display real-time data, this required us to continuously gather the data through APIs, and stream it into BigQuery.
Oslo City Bike and Entur (who delivers information about public transportation and e-scooters), both have open real-time APIs. GCP provides the ability to create scheduled functions that collect data through an API and insert it into rows in a BigQuery table. These simple functions can be written using Python or another language of your choice. This is the function I use for obtaining the most recent data through Oslo City Bike’s API and storing it in a BigQuery table:
Function to stream data from API to a BigQuery table:
from google.cloud import bigquery
BQ = bigquery.Client()
dataset_id = ‘bysykkel'
table_id = ‘status'
table_ref = BQ.dataset(dataset_id).table(table_id)

def hello_pubsub(event, context):
    table = BQ.get_table(table_ref)
    data = requests.get( "https://gbfs.urbansharing.com/oslobysykkel.no/station_status.json")
    json_rows = data.json()\[«data"]\["stations"]
    BQ.insert_rows_json(table_ref, json_rows)
2. Build relevant queries
When the functions are up and running, your table(s) will continuously be populated with the newest data, and you can start playing around in BigQuery to extract the information you want.
In our case, we did not just want to present the raw data points. For example, for the city bike part of the dashboard we wanted to:
- Show how many bikes were available in the Vippetangen racks
- Show other racks within a given radius with available bikes
- Show number of available docks near public transport hubs to dock your bike
- Display the station names, which were not collected in the real-time data table
These data points were not immediately available in our data table, and so we had to build different queries for manipulating the data as we wanted. Below is an example of a query to display the three racks near Stortinget metro station with available docks.
Example of showing 3 available dockings near Stortinget station:
SELECT DISTINCT
  name as stasjon, num_docks_available, latitude, longitude
FROM
  `dashboard.bysykkel.status` AS status
LEFT JOIN `entur-257612.bysykkel.station_names` AS s ON status.station_id = s.id -- to get the names of the stations stored in another table
WHERE last_reported = (SELECT max(last_reported) FROM `entur-257612.bysykkel.status`) -- to get the last reported status
AND num_docks_available > 0 -- to avoid displaying racks without available docks
GROUP BY
  name, station_id, num_docks_available, latitude, longitude
ORDER BY sqrt(power(59.9130 - latitude, 2) + power(10.7419 - longitude, 2)) -- the euclidian distance from Stortinget station
LIMIT 3"Heads up:
In this case we only needed the real-time data, but there was no need to store the historical data. However, BigQuery is not as intuitive when it comes to updating or deleting rows. Continuously adding rows to your data table makes it grow in size quite rapidly, and both storage and querying can become costly. I wasn’t able to implement a function to replace the data in my BigQuery tables instead of just adding new rows on every API call. My quick workaround was to write a script that ran every night, removing the rows from 2 days before and prior, but I’m quite certain there are other more elegant solutions to this problem."
To be continued...
In part 2 we will look at how you can save your queries as views, and visualize the data with a DataStudio dashboard.
