Converting subjective data to objective data
The modern consumer is blessed with an endless supply of products and services that address their needs. In such a competitive environment, companies need to understand the driving forces shaping consumers perception of its products and services. How else can Burger King entice modern consumers into buying their milkshake from them instead of McDonalds? Or how can Nike convince the occasional jogger that their shoes are better than a pair of sneakers with the three tilted and iconic Adidas-stripes imprinted on the side?
3 min read
·
By Oscar Hafstad
·
December 16, 2019

To make things worse, consumer perceptions can be extremely challenging to measure. If sales are increasing after a marketing campaign, it might be because of a wide range of things not related to a change in how consumers perceive the company in question. It might be caused by an increased awareness of the brand, rather than an improvement in the brand perception per se or by an exogenous event such as a competitor having screwed up.
One way to mitigate this problem is to analyze the information contained in unstructured data. Two relatively simple techniques that can be used for this purpose are sentiment analysis and wordclouds.
The first is built on the idea that matching text with a sentiment lexicon gives the data scientist insights into the underlying sentiment being expressed in a given text. “I am happy” is labelled “positive” because the word “happy” has a positive score in the sentiment lexicon.
The second technique is built on the idea that the most frequently used words in a text will tell the data scientist something about the content of the text and the corresponding sentiment. In order for this to work, the data scientist first needs to remove uninteresting words, often called stopwords, from the equation (learning that “the”, “and”, “is” and “are” were mentioned frequently in the text is probably not very interesting). Once this is done, it is relatively straightforward to create a wordcloud that will give the reader a quick glimpse into the most important aspects of the text.
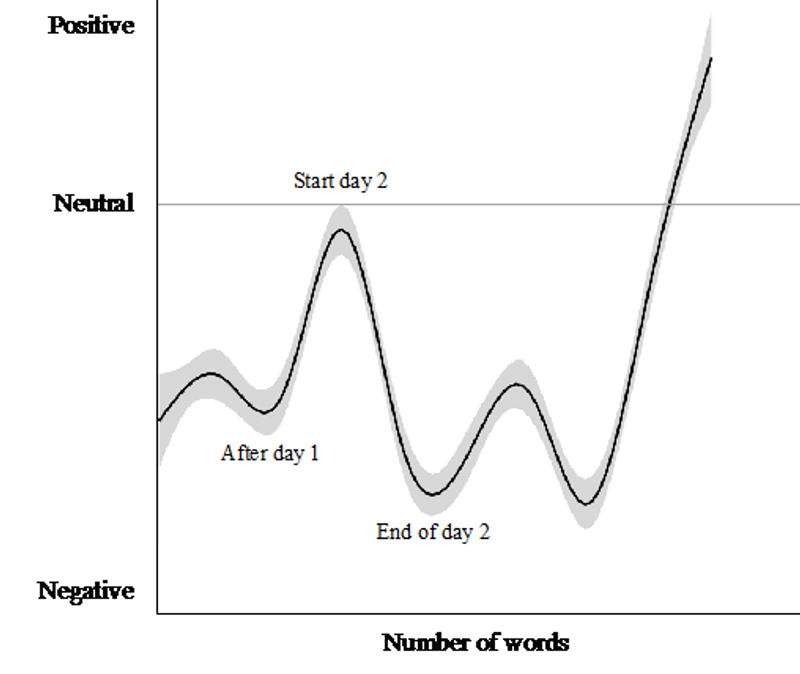
The usefulness of sentiment analysis can be illustrated by the following graph. The graph shows the sentiment expressed in tweets mentioning Boeing CEO David Muilenburg, during the time period in which he testified in a congressional hearing (29th and 30th of October) about the tragic crashes of the 737 Max airplanes. A couple of interesting insights can be drawn from the graph.

First of all, it appears that the expressed sentiment is at its lowest immediately after the two days of hearings. In other words, people tweeting about the hearings while they went on were predominantly negative, and increasingly so. This insight might be used by the legal team of Boeing to adjust their strategy for the next legal battle they face, thereby increasing the likelihood of convincing the jury of Boeings innocence. Another observation that can be used in a similar way is the finding that the second day of hearings produces a lower sentiment score than the first day. Digging into the reasons for this may enable Boeing to increase their chances of winning in court in the future.
A related insight is that people tweeting about the hearing are mostly negative. In this particular case, this might not be very surprising. In other cases, however, this might be an important finding.
Third, it is very clear that the sentiment becomes much more positive shortly after the hearings. In other words, it seems like Boeing’s CEO did not make such a horrible impression after all. From a business point of view, this kind of analysis can for example be used to evaluate the lasting impact of a marketing campaign or another event that may have effects on the reputation of a company.
Naturally, as with all kinds of analysis, a good dose of critical thinking must be used when applying these techniques. That does not mean, however, that untraditional ways of analyzing data should be left unexplored.